History of Changes in the Earth's Temperature
How Hot Has the World Got?
The earth's average temperature rose by 0.8 °C (1.5 °F) during the last century.
That change is in the mean global temperature that has been calculated for each year since 1880. The history of average global temperature is based on data gathered around the world at weather stations, on ships and by satellites.
These records clearly show that the first decade of the 21st century was the warmest since the 1880s, and the first decade that the earth's average annual temperature rose above 14.5 °C (58 °F).
Temperature Change Since 1880
Despite the overall increase, global temperatures have not climbed steadily during the decades. The average global annual temperature hovered around 13.7 °C (56.7 °F) from the 1880s through the 1910s.
During the 1920s to 1940s, temperatures climbed about 0.1 °C (0.18 °F) each decade. Mean global temperatures then stabilized at roughly 14.0°C (57.2 °F) until the 1980s.
The world has mainly grown hotter since 1980, at a rate of nearly 0.2 °C (0.36 °F) per decade. The annual global temperature from 2000 to 2009 was 0.61 °C (1.1 °F) higher than the average temperature for 1951 to 1980. If the current rate of increase continues, the world will warm by 2 °C (3.6 °F) in the next century.
| Decade | °C | °F |
|---|---|---|
| 1880s | 13.73 | 56.71 |
| 1890s | 13.75 | 56.74 |
| 1900s | 13.74 | 56.73 |
| 1910s | 13.72 | 56.70 |
| 1920s | 13.83 | 56.89 |
| 1930s | 13.96 | 57.12 |
| 1940s | 14.04 | 57.26 |
| 1950s | 13.98 | 57.16 |
| 1960s | 13.99 | 57.18 |
| 1970s | 14.00 | 57.20 |
| 1980s | 14.18 | 57.52 |
| 1990s | 14.31 | 57.76 |
| 2000s | 14.51 | 58.12 |
Some Places Are Warming Faster
The global temperature values come from data collected around the world that were rolled together to calculate an average for the entire planet. What the global numbers don't show is that temperatures have changed at different rates in different parts of the world. On a large scale, the amount of change depends upon whether a site is located on land or at sea, in the northern or southern hemisphere, and at a pole or the equator.
Air over land has historically warmed faster than the oceans. With water covering over 70% of the planet, sea surface temperatures dominate the global average.
The Northern Hemisphere has warmed faster than the Southern Hemisphere, and the entire Arctic has warmed faster than anywhere else in the world.
The northern polar region, above 64 °N latitude, averaged 2.5 °C (4.5 °F) higher annual temperatures during 2000 to 2009 than in the 1880s.
Like the earth as a whole, most of the Arctic's increase occurred during the last three decades. Near the North Pole, the mean annual temperature during 2000 to 2009 was 1.8 °C (3.24 °F) above the average temperature there for 1951 to 1980.
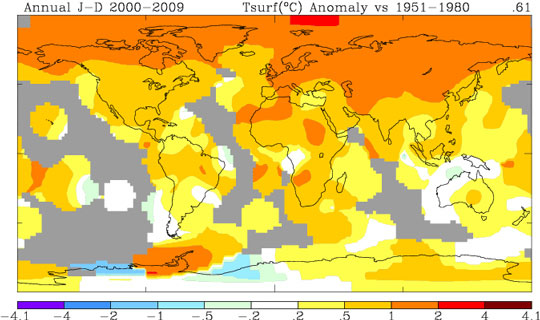
World map color-coded to show differences in average annual temperatures (in degrees Celsius) for 2000 - 2009 compared with 1951 - 1980. Source: Goddard Institute for Space Studies
About the Temperature Data
The temperature data are provided publicly by NASA's Goddard Institute for Space Studies (GISS), based in New York City. GISS has compiled and analyzed data from a thousand weather stations around the world, ship and satellite observations of sea temperatures, and measurements at Antarctic research stations to form a global temperature index. The annual averages go back in history only to 1880, when meteorologists began using modern scientific instruments to monitor temperatures precisely.
References
GISS (Goddard Institute for Space Studies). 2010. Surface Temperature Analysis.
James Hansen, Makiko Sato, Reto Ruedy, Ken Lo, David W. Lea and Martin Medina-Elizade. 2006. Global temperature change. PNAS.103(39): 14288-14293.