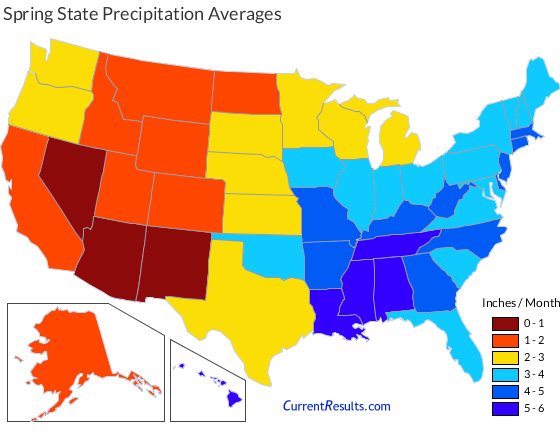
USA State Precipitation Mapped For Each Season
This sequence of USA maps illustrates how the amount of rain and snow that falls in each state changes across the seasons.
The series allows you to visually compare average precipitation among American states and through the year.
A state's color is based on its average monthly precipitation for the season. Each color represents a one-inch increment in total precipitation per month. All the maps use the same color scale, ranging from red-brown for the driest states to purple for the wettest ones.
The snow and rainfall amounts are state-wide averages calculated from data collected by weather stations throughout each state during the years 1971 to 2000 and made available by the NOAA National Climatic Data Center of the United States.
You can see the numbers behind each map plus more information about state-wide precipitation averages on a page for each season: Spring, Summer, Fall and Winter.