Fall Precipitation Averages for Every State
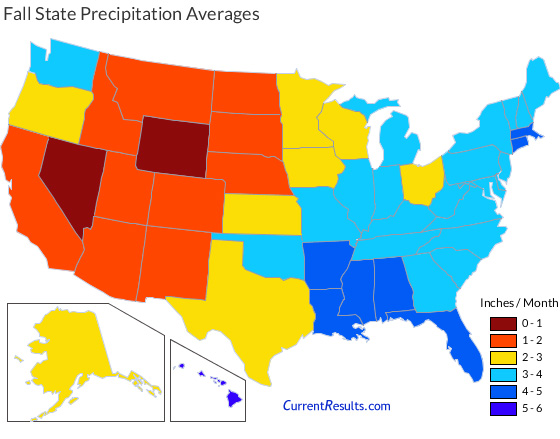
The map here shows how the amount of rain and snowfall per month in fall compares across the American states. Below the map are the data it's based on.
Plus there's a ranking of states in autumn from wettest to driest.
State-wide averages of monthly precipitation in fall range from a high of 5.23 inches (133 millimetres) in Hawaii to a low of 0.76 inches (19 millimetres) in Nevada. For the entire United States, excluding Hawaii and Alaska, the average amount of moisture falling as rain and snow is 2.42 inches (61 millimetres).
The precipitation totals are averages for the months of September, October and November. These are based on data collected by weather stations throughout each state during the years 1971 to 2000 and made available by the NOAA National Climatic Data Center of the United States.
How much precipitation each state in the US gets on average in a month during fall is listed below in inches and millimeters. The states are also ranked from the wettest state in fall at number 1, to the driest state at number 50.
| State | Inches | Millimetres | Rank |
|---|---|---|---|
| Alabama | 4.07 | 103 | 8 |
| Alaska | 2.49 | 63 | 35 |
| Arizona | 1.16 | 29 | 46 |
| Arkansas | 4.33 | 110 | 4 |
| California | 1.47 | 37 | 41 |
| Colorado | 1.18 | 30 | 45 |
| Connecticut | 4.35 | 110 | 3 |
| Delaware | 3.62 | 92 | 19 |
| Florida | 4.24 | 108 | 5 |
| Georgia | 3.47 | 88 | 24 |
| Hawaii | 5.23 | 133 | 1 |
| Idaho | 1.48 | 38 | 40 |
| Illinois | 3.15 | 80 | 29 |
| Indiana | 3.25 | 83 | 28 |
| Iowa | 2.68 | 68 | 34 |
| Kansas | 2.19 | 56 | 38 |
| Kentucky | 3.55 | 90 | 23 |
| Louisiana | 4.56 | 116 | 2 |
| Maine | 3.71 | 94 | 16 |
| Maryland | 3.58 | 91 | 20 |
| Massachusetts | 4.11 | 104 | 7 |
| Michigan | 3.08 | 78 | 30 |
| Minnesota | 2.25 | 57 | 37 |
| Mississippi | 4.13 | 105 | 6 |
| Missouri | 3.70 | 94 | 17 |
| State | Inches | Millimetres | Rank |
|---|---|---|---|
| Montana | 1.08 | 27 | 48 |
| Nebraska | 1.60 | 41 | 39 |
| Nevada | 0.76 | 19 | 50 |
| New Hampshire | 3.84 | 98 | 12 |
| New Jersey | 3.76 | 96 | 14 |
| New Mexico | 1.32 | 34 | 43 |
| New York | 3.76 | 96 | 14 |
| North Carolina | 3.92 | 100 | 11 |
| North Dakota | 1.29 | 33 | 44 |
| Ohio | 2.95 | 75 | 31 |
| Oklahoma | 3.32 | 84 | 26 |
| Oregon | 2.29 | 58 | 36 |
| Pennsylvania | 3.58 | 91 | 20 |
| Rhode Island | 4.04 | 103 | 9 |
| South Carolina | 3.70 | 94 | 17 |
| South Dakota | 1.36 | 35 | 42 |
| Tennessee | 3.98 | 101 | 10 |
| Texas | 2.71 | 69 | 33 |
| Utah | 1.12 | 28 | 47 |
| Vermont | 3.77 | 96 | 13 |
| Virginia | 3.58 | 91 | 20 |
| Washington | 3.46 | 88 | 25 |
| West Virginia | 3.31 | 84 | 27 |
| Wisconsin | 2.84 | 72 | 32 |
| Wyoming | 0.97 | 25 | 49 |